 | When analyzing data, I often find myself computing the percentile value. As I am a big fan of PowerPivot, I went with it lately to analyze some data and tried to get the 90th percentile of my series. So I chose to create a DAX measure and went looking for the PERCENTILE function only to discover that: |
| Normal Distribution courtesy of Peter Strandmark @ Wikipedia |
PowerPivot DAX doesn't support PERCENTILE! Even more shocking, neither is the much more common MEDIAN measure supported.
Don't panic folks; Marco Russo was kind enough to share his way of computing the median. With a tiny tweak it allows us to compute the 90th percentile as such:
MINX(FILTER(VALUES(MyDataSerie1[Col1]), CALCULATE(COUNTROWS(MyDataSerie1), MyDataSerie1[Col1] <= EARLIER(MyDataSerie1[Col1]) ) > COUNTROWS(MyDataSerie1)*0.9), MyDataSerie1[Col1]) |
The important part is 0.9. Just replace it with 0.5 for the median, 0.25 for the first quartile and so forth.
I bet the Excel and SQL folks had good reasons not to include these functions, if you have any idea why, leaves me a message. I also posted a line on the MSDN forum(http://social.msdn.microsoft.com/Forums/en/sqlkjpowerpivotforexcel/thread/b1ccf0e6-d5d3-4405-9748-4381a310b57b ).
Accuracy of this measure
I am no statistician, the formula looked ok but I wanted more assurance about its accuracy. Thus I fixed a little test to compare the percentile computed with this DAX measure to regular Excel PERCENTILE.INC and PERCENTILE.EXC formula. I computed the 5,25,50,75,90,95 percentiles using these 3 means for 3 different kind of number series and then averaged the difference between those :
| DiffINC is the difference in percentage between PERCENTILE.INC and the DAX measure. Same for DiffEXC. |  |
As you can see, this DAX measure is giving results pretty close (less than 0,05% error) to the PERCENTILE.INC Excel formula. This is close enough for my needs anyway. Yet be careful, with smaller number series (less than 50 items), the error went up to reach values as high as 5% on some cases.
Percentile Explanation
By the way, for those unfamiliar with percentile, the Nth percentile is the value below which N% of the value fall. More details on Wikipedia.
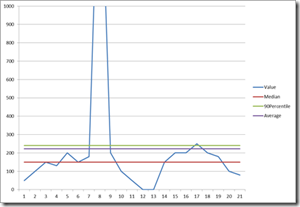
 Ok, so why it is useful you might ask, well it is common to analyze your data series without the extreme values that might indicate problem with your data source. An example is in the software performance testing field where you will usually consider the 90th or 95th values of the response time in order to know what the reasonable highest response time is without considering test aberrations or errors.
N.B: Some of you might have noticed the new addition to the title of this blog: Jonathan's IT blog – SharingPointers, tell me what you think in the comments !

